Performance Bar
You can display the GitLab Performance Bar to see statistics for the performance of a page. When activated, it looks as follows:

From left to right, it displays:
- Current Host: the current host serving the page.
-
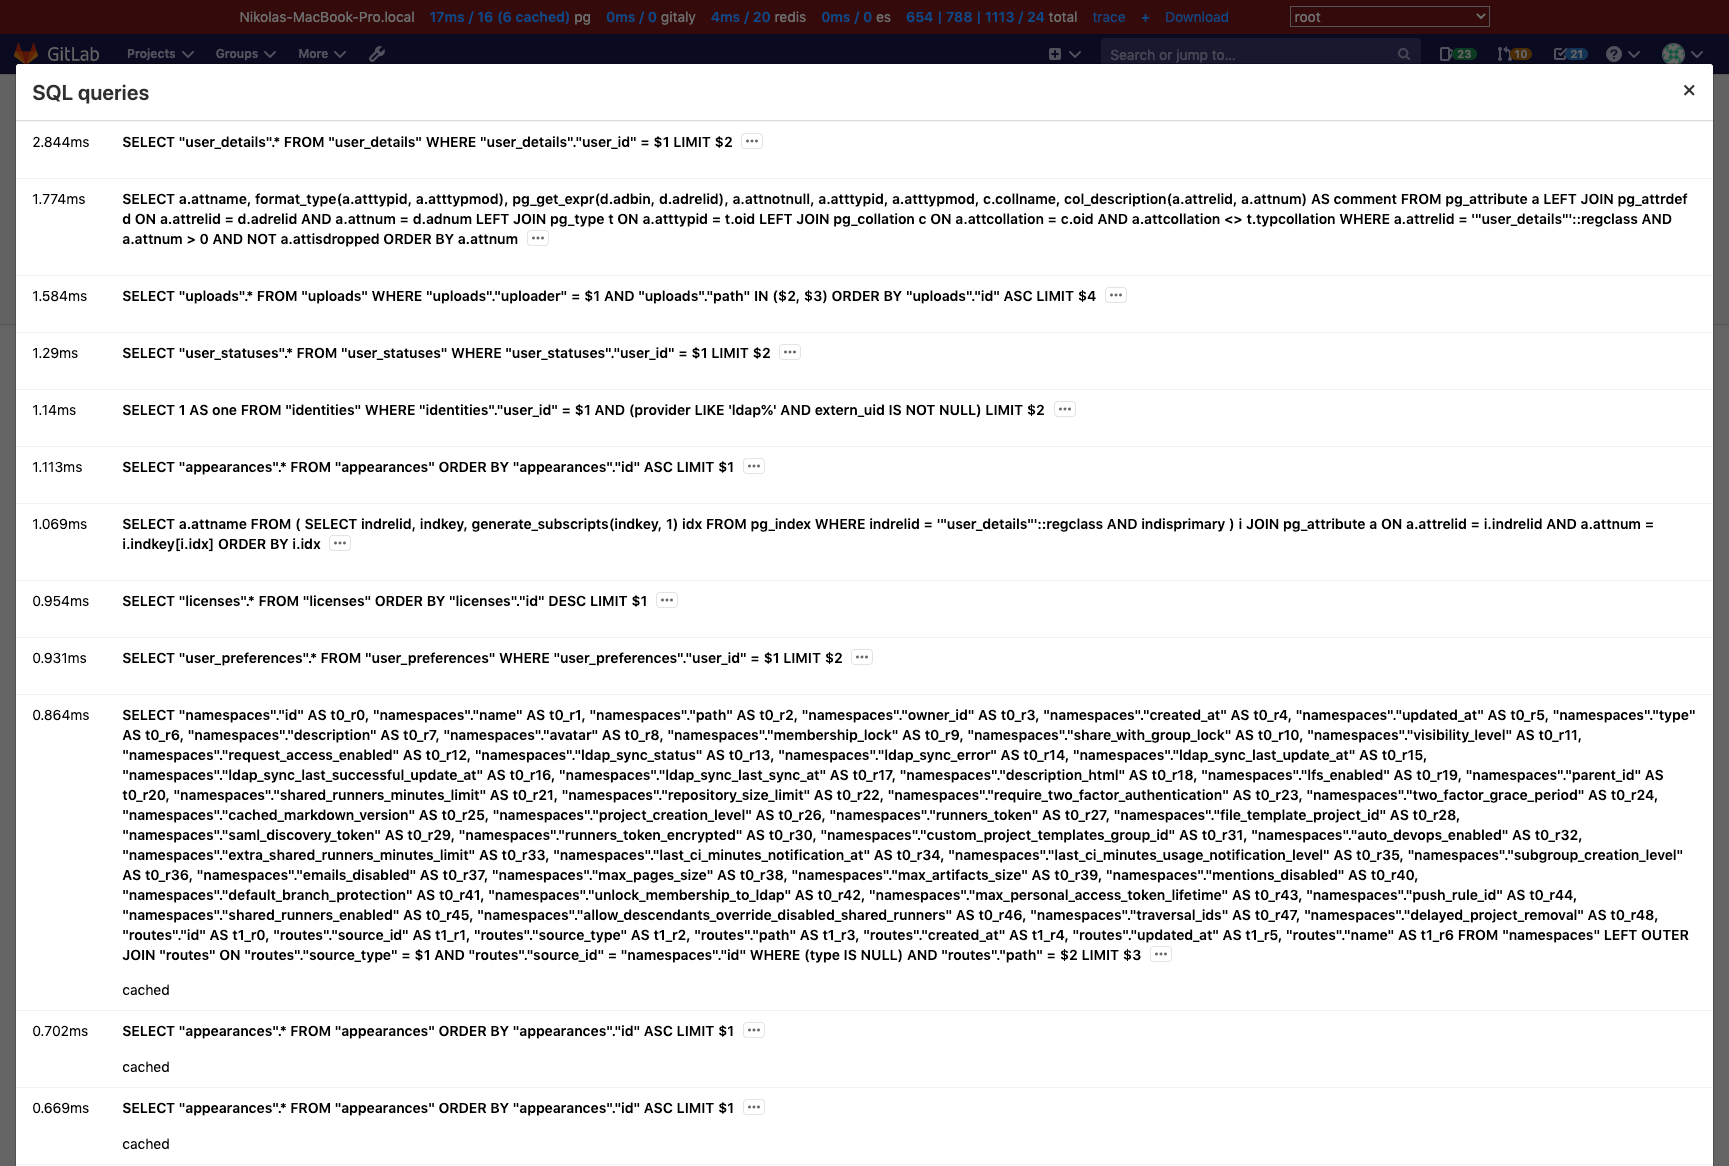
Database queries: the time taken (in milliseconds) and the total number
of database queries, displayed in the format
00ms / 00 (00 cached) pg. Click to display a modal window with more details:
-
Gitaly calls: the time taken (in milliseconds) and the total number of
Gitaly calls. Click to display a modal window with more
details:
-
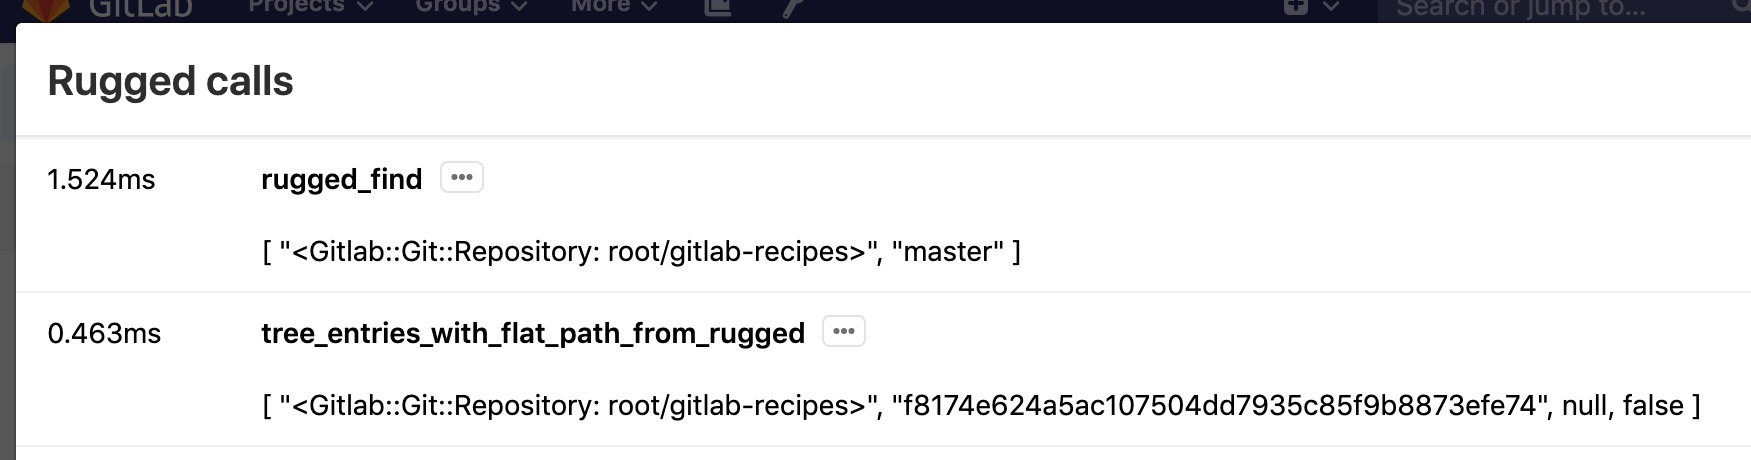
Rugged calls: the time taken (in milliseconds) and the total number of
Rugged calls.
Click to display a modal window with more details:
-
Redis calls: the time taken (in milliseconds) and the total number of
Redis calls. Click to display a modal window with more details:
- Elasticsearch calls: the time taken (in milliseconds) and the total number of Elasticsearch calls. Click to display a modal window with more details.
-
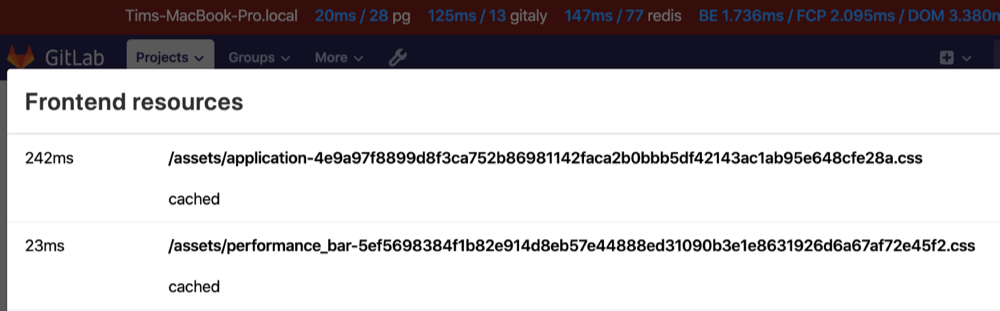
Load timings of the page: if your browser supports load timings (Chromium
and Chrome) several values in milliseconds, separated by slashes.
Click to display a modal window with more details. The values, from left to right:
- Backend: time needed for the base page to load.
- First Contentful Paint: Time until something was visible to the user.
- DomContentLoaded Event.
-
Total number of requests the page loaded:
-
Trace: If Jaeger is integrated, Trace links to a Jaeger tracing page
with the current request's
correlation_idincluded. -
+: A link to add a request's details to the performance bar. The request
can be added by its full URL (authenticated as the current user), or by the value of
its
X-Request-Idheader. - Download: a link to download the raw JSON used to generate the Performance Bar reports.
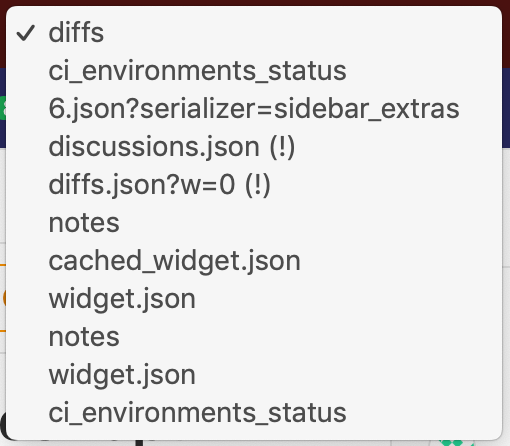
- Request Selector: a select box displayed on the right-hand side of the Performance Bar which enables you to view these metrics for any requests made while the current page was open. Only the first two requests per unique URL are captured.


Request warnings
Requests exceeding predefined limits display a warning {warning} icon and explanation next to the failing metric. In this example, the Gitaly call duration exceeded the threshold:

If any requests on the current page generated warnings, the warning icon displays next to the Request selector:

Requests with warnings display (!) after their path in the Request selector:
Enable the Performance Bar via the Admin panel
The GitLab Performance Bar is disabled by default. To enable it for a given group:
- Sign in as a user with Administrator permissions.
- In the menu bar, click Admin Area.
- Navigate to Settings > Metrics and profiling
(
admin/application_settings/metrics_and_profiling), and expand the section Profiling - Performance bar. - Click Enable access to the Performance Bar.
- In the Allowed group field, provide the full path of the group allowed to access the GitLab Performance Bar.
- Click Save changes.
Keyboard shortcut for the Performance Bar
After enabling the GitLab Performance Bar, press the p + b keyboard shortcut to display it, and again to hide it.