CI/CD Analytics
Pipeline success and duration charts (CORE)
- Introduced in GitLab 3.1.1 as Commit Stats, and later renamed to Pipeline Charts.
- Renamed to CI/CD Analytics in GitLab 12.8.
GitLab tracks the history of your pipeline successes and failures, as well as how long each pipeline ran. To view this information, go to Analytics > CI/CD Analytics.
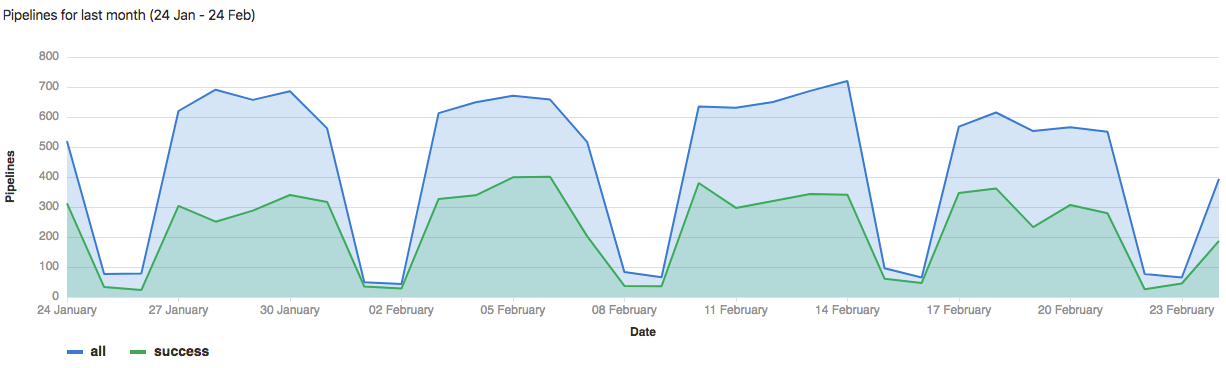
View successful pipelines:
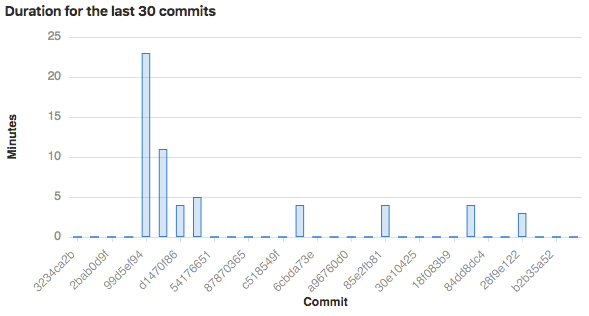
View pipeline duration history:
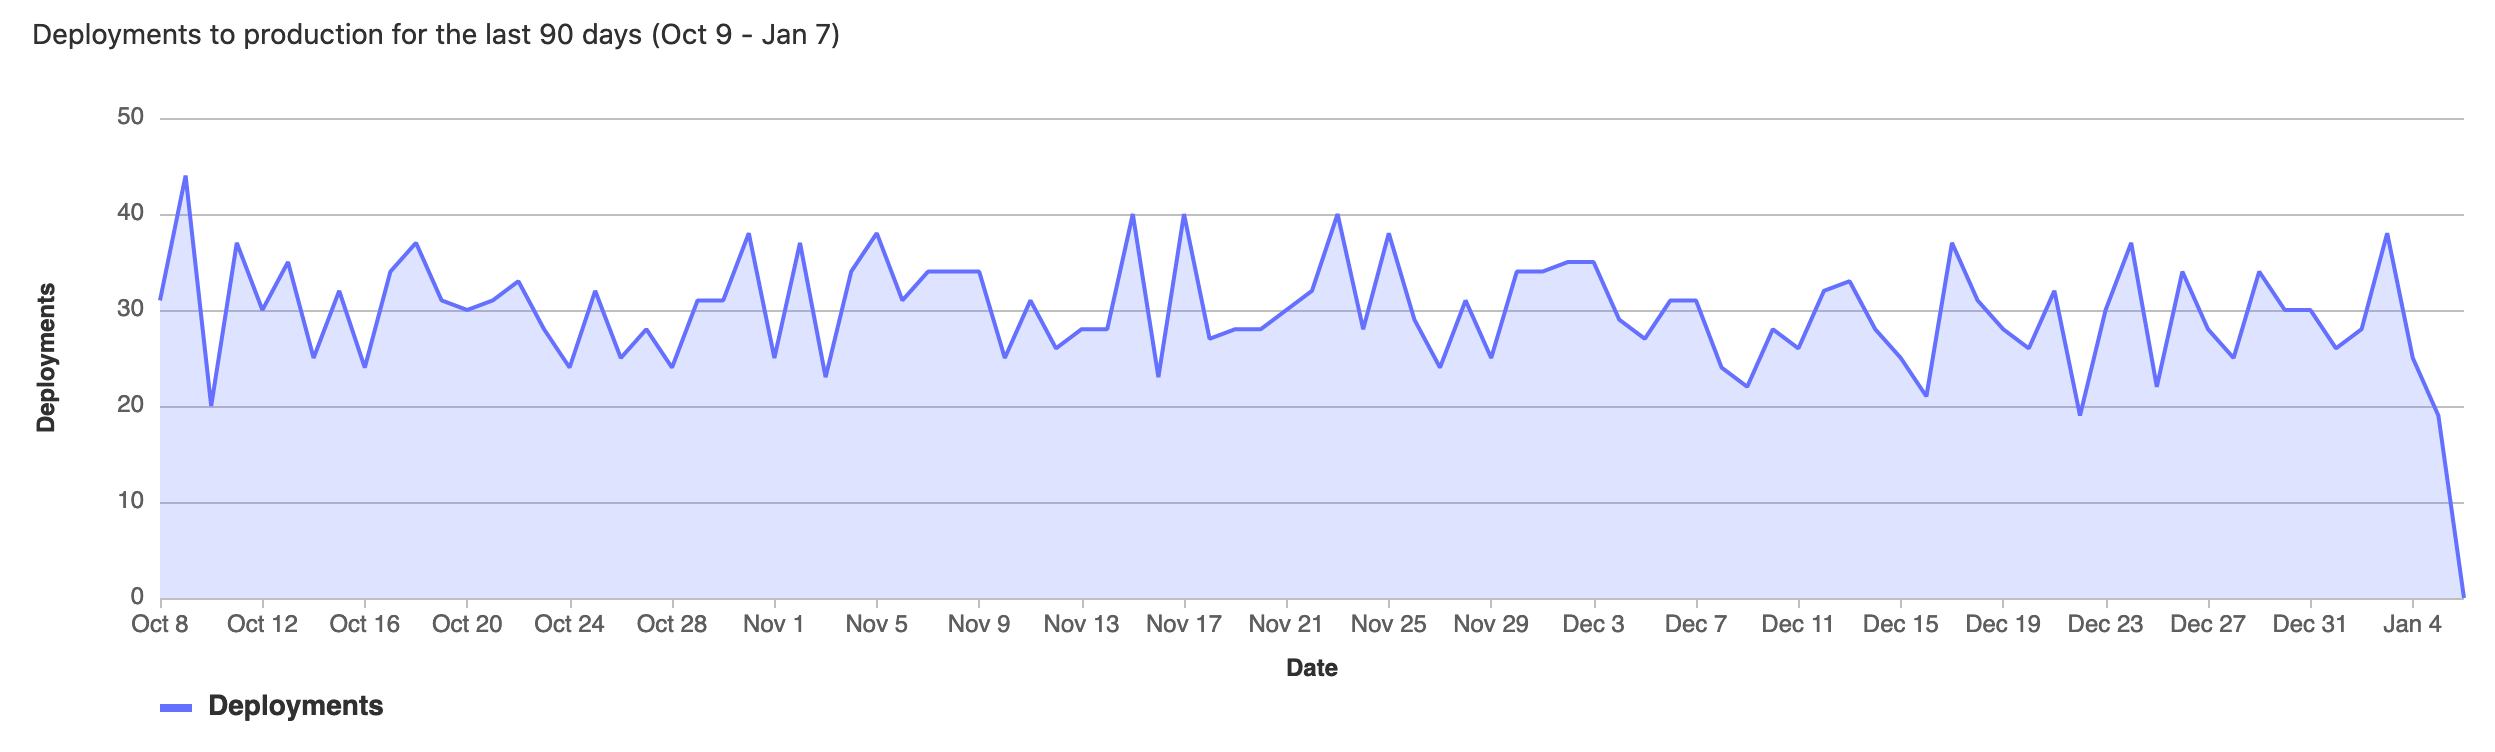
Deployment frequency charts (ULTIMATE)
Introduced in GitLab 13.8.
The Analytics > CI/CD Analytics page shows information about the deployment frequency to the
production environment. The environment must be named production for its deployment
information to appear on the graphs.